Overview
Lightning Insights are a collection of powerful reporting tools to get a handle on the performance and status of your practice.Workflow Instructions
Navigating to Lightning Insights
Navigate in the Toolbar to Reports → ⚡️ Lightning Insights.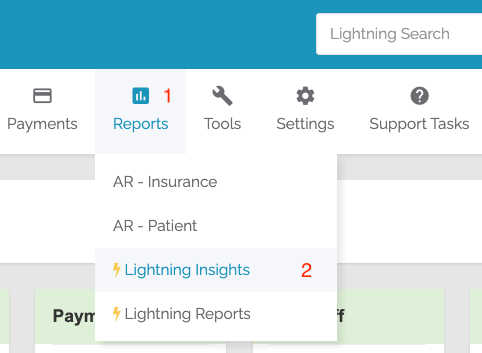
Default Settings
Lightning Insights defaults to:- Month-to-Date (MTD) range
- Organized by Posting Date
- All Providers
- All Locations
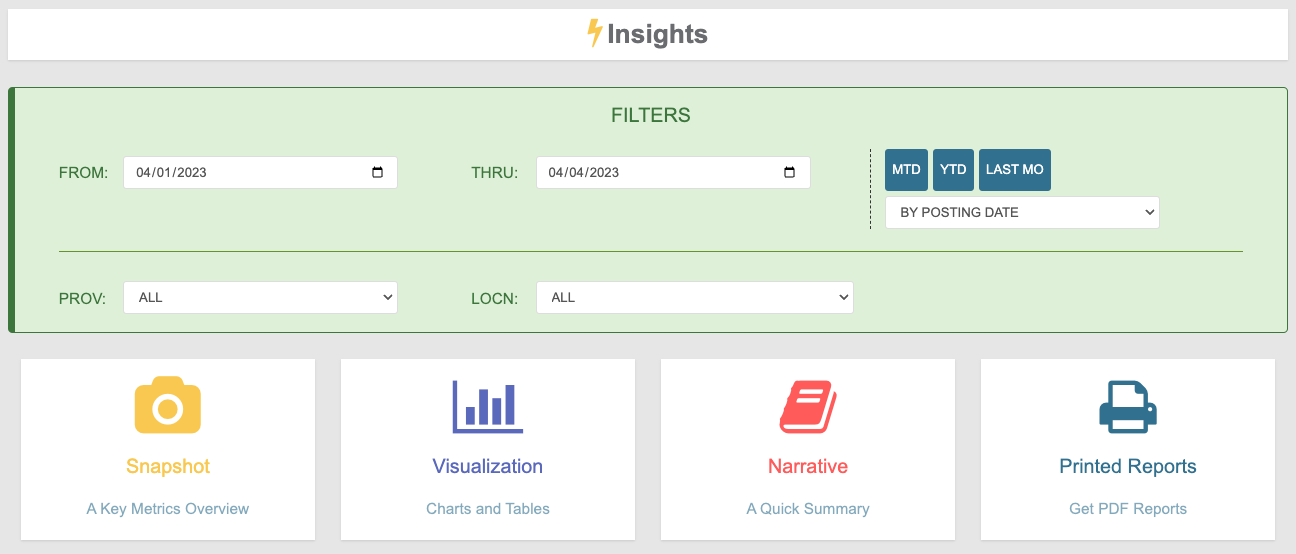
Filters
- FROM and THRU - Determine the date range
- Posting Date vs Service Date - Choose how dates are interpreted
- PROV and LOCN - Filter by specific Provider or Location
Functions
Select any function to view data. To expand filters again, select SHOW FILTERS.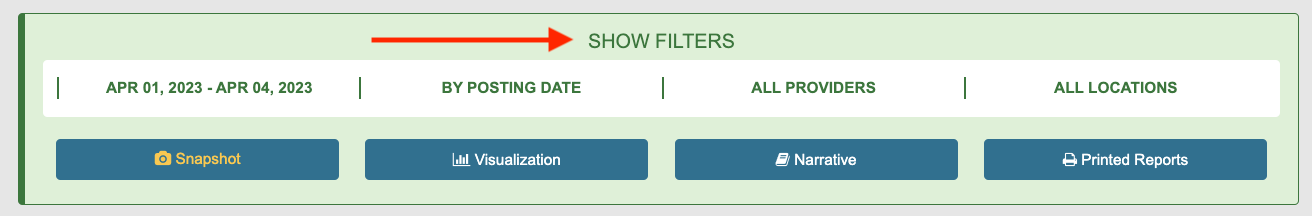
Snapshot
Provides an at-a-glance overview of your Practice’s performance and an overview of Insurance and Patient AR. Includes comparison to Last Month’s performance.Visualization
Represents various KPIs as Line or Bar graphs, organized by Days or Months. Includes a spreadsheet breakdown of the KPI.Narrative
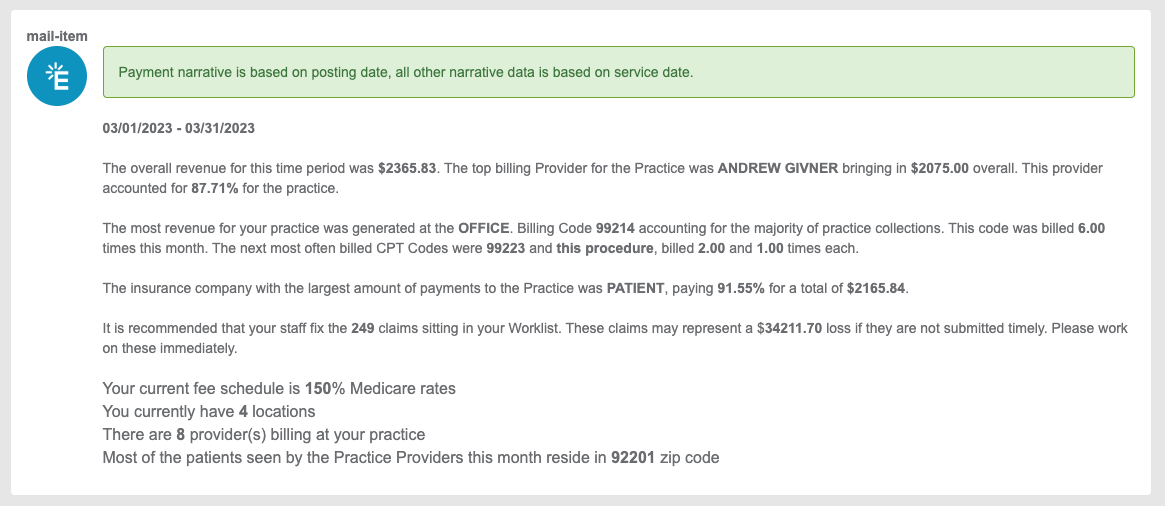
Presents a text-based breakdown including:- Revenue
- Top billing Provider
- Top earning Location
- 3 most-billed CPTs
- Top-paying Payer
- Value of Worklist Claims
- Practice statistics
Printed Reports
Generate downloadable reports based on selected filters:- Narrative Report
- AR Insurance Report
- Payments Report
- Code Report
- Locations Report
- Providers Report
- Inpatient/Outpatient Report