Overview
What is Denials Reporting?
Elation Billing includes several reports that help you track and manage claim denials. Electronic Remittance Advice (ERAs) are integrated into these reports, ensuring that denial information is accurate and up to date.Why is Denials Reporting important?
Denial reporting keeps you up to date on why claims are being denied. By spotting trends early, you can tackle issues at the source—helping improve claim acceptance and speed up payments.Workflow Instructions
Using the Denied Claims Report
- Click Reports → Lightning Insights
- Click Visualization
- Click Denied Claims
- You will see the denied claims for the timeframe specified at the top of the page
- Click Show Filters to see and adjust filters as needed
- Click on the Claim Count # to see associated claims
Using the Denied Claims by Payer Report
- Click Reports → Lightning Insights
- Click Visualization
- Click Denied Claims by Payer
- You will see the top 10 payers with denied claims for the timeframe specified
- Click Show Filters to adjust filters as needed
- Click a code in the legend to exclude it from the chart (it will appear crossed out but still show in the table)
- Click on the Claim Count # to see associated claims
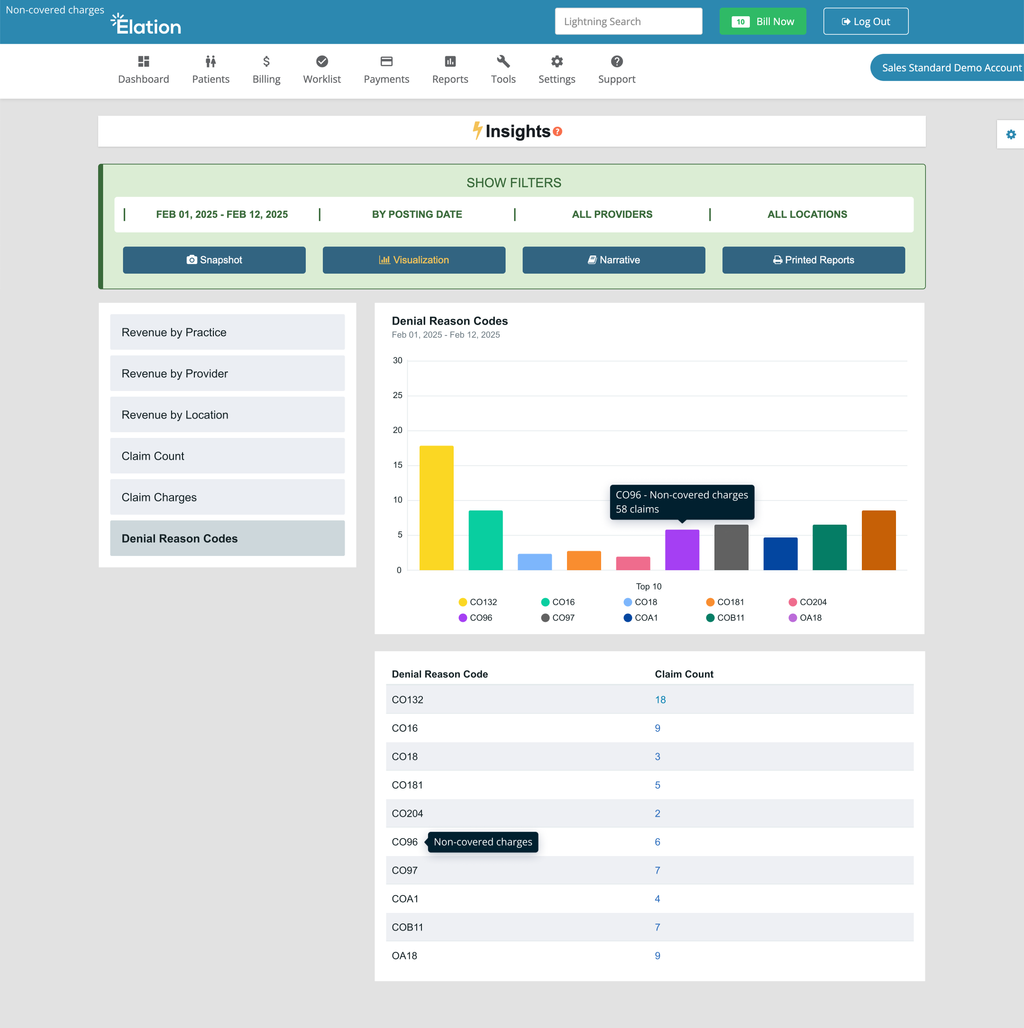
Using the Denial Reason Codes Report
- Click Reports → Lightning Insights
- Click Visualization
- Click Denial Reason Codes
- You will see the top 10 denial reason codes for the timeframe specified
- Click Show Filters to adjust filters as needed
- Click a code in the legend to exclude it from the chart
- Click on the Claim Count # to see associated claims
Using the Denied Procedure Codes Report
- Click Reports → Lightning Insights
- Click Visualization
- Click Denied Procedure Codes
- You will see the top 10 denied procedure codes for the timeframe specified
- Click Show Filters to adjust filters as needed
- Click a code in the legend to exclude it from the chart
- Click on the Claim Count # to see associated claims
Using the Denials Report (Downloadable)
- Click Reports → Lightning Reports
- Click Options next to Denials Report to apply additional filters as needed
- Click Download Report → Save as Excel (CSV)
- Open the report on your computer using Excel-compatible software