
Overview
What are growth charts?
Growth charts help you track a patient’s height, weight, BMI, and head circumference distribution over time for patients 21 and younger. Elation’s growth charts use the following guidelines:- WHO guidelines for children from birth to 24 months.
- CDC guidelines for children between 2 and 20 years.
How do growth charts work?
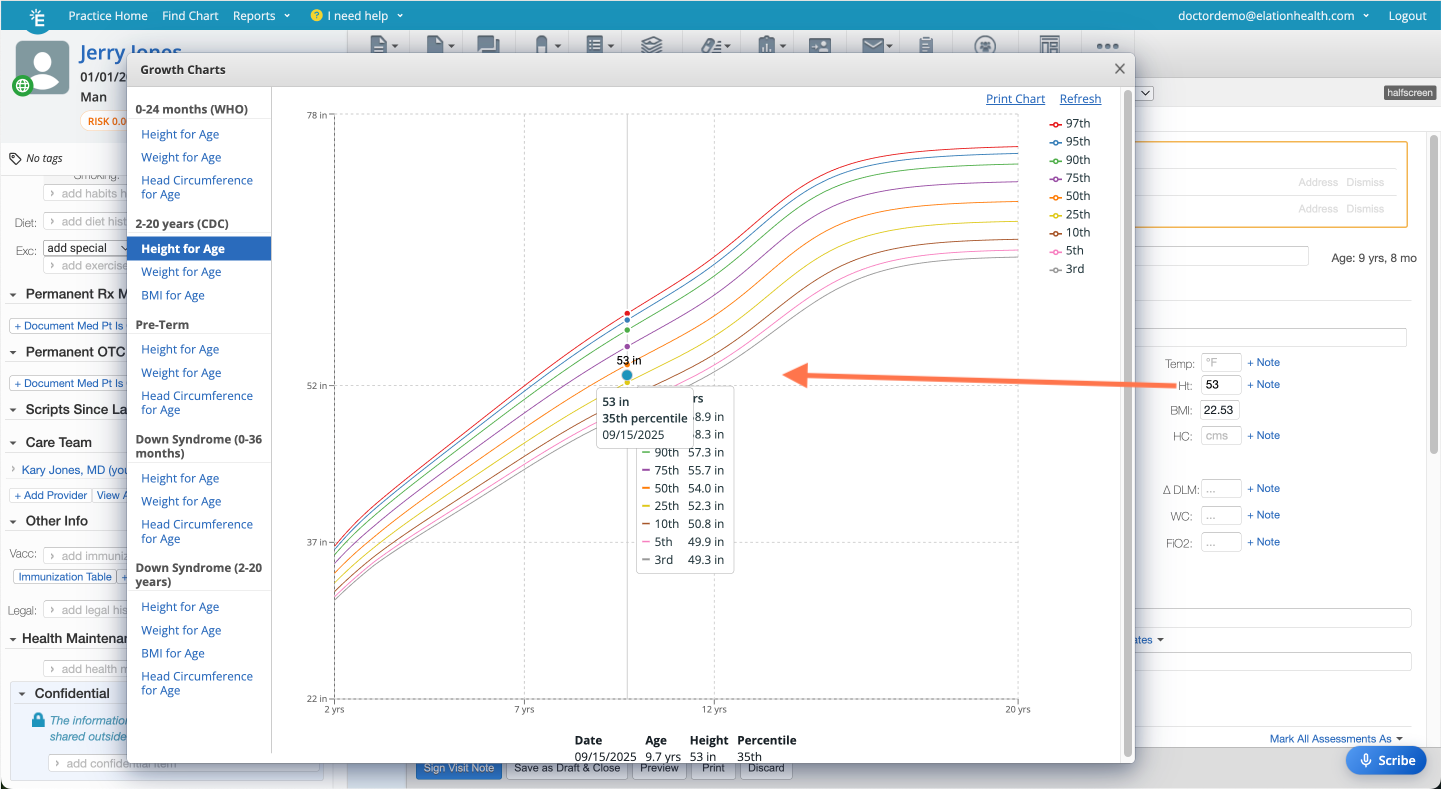
Once you add a patient’s height, weight, and/or head circumference in the Vitals section of a note, that data point will automatically plot on the corresponding growth chart. The percentiles for height, weight, and BMI will also appear on the charts. When entering vitals, you can type values in any common unit — including metric and imperial — and Elation will automatically convert them to the standard stored unit. This is especially useful for pediatric workflows where you may frequently switch between metric and imperial measurements. For example, you can enter height as170 cm or 5'10", weight as 70 kg, and head circumference as 14 in. Compound inputs, fractions, and European-style decimal commas are also supported.
Visit notes do not need to be signed in order for you to see vitals from that visit populated on the growth chart.
Which growth charts are available?
There are five categories of growth charts available in Elation:- 0-24 months (WHO)
- Height
- Weight
- Age
- Head Circumference
- 24-36 months (CDC)
- Head Circumference
- 2-20 years (CDC)
- Height
- Age
- BMI
- Pre-Term*
- Height
- Weight
- Head Circumference
- Down Syndrome (0-36 months)
- Height
- Weight
- Head Circumference
- Down Syndrome (2-20 years)
- Height
- Weight
- BMI
- Head Circumference
To plot values on the Pre-Term Growth Chart, you first need to add a preterm infant diagnosis to the patient’s Problem List. The diagnosis must specify the number of weeks of gestation (e.g., Preterm infant, birth weight 500-749 grams, with 24 completed weeks of gestation). Additionally, the vitals must be recorded on a visit note that is dated before the 40-week gestation period to appear on the chart.
Workflow Instructions
Viewing growth charts
You have four options for accessing growth charts in Elation:
Here’s how to read a growth chart:
- The chart is color-coded to help you easily identify percentile trends.
- The patient’s vitals are marked by a dark blue dot. You can hover over any dot on the graph to see the exact value, percentile and record date.
- To view the patient’s growth chart data in a table format, simply scroll down within the growth chart window.
Sharing growth charts
Attaching growth charts to Letters or Referrals
To attach a growth chart to a Patient Letter, Provider Letter or Referral:- Open a new Patient Letter, Provider Letter or Referral draft.
- Click Select Chart Items to Attach.
- Select Growth Charts.
- Select the growth charts you want to attach.
- Click Attach Items.
Printing growth charts
Click the Print Chart button at the top of each growth chart to print a growth chart. Growth charts will print in black and white. The percentile lines and exact value will be printed but the exact percentile of each value will not be printed.+Troubleshooting missing or unexpected percentiles
If percentiles are not displaying on a growth chart or appear incorrect, verify the following:
If further assistance is required after following the above troubleshooting steps, click I need help -> Contact Elation Support to submit a request.